
Introduction
In the world of trading robots, success is usually measured in months. A pretty backtest, a strong start, a screenshot with +100%, and half a year later, silence. I’ve been building Expert Advisors for about ten years and have watched hundreds of systems live and die. The ones that survive rarely look impressive in the moment. They look impressive over the distance.
Stock Trader Pro was released in 2020. It was my first strategy for the US stock market. Back then the Market was all about EURUSD and forex grids, and I already understood that forex is essentially a currency exchange counter. It’s a market close to random, with few durable patterns. The stock market runs on a different basis: companies have fundamentals, and growth has a reason behind it.
Six years have passed since then. The system has lived through the bearish 2022, my forced pause, and another round of geopolitics. Today I want to show what it’s doing right now, and break down honestly how to read it.
The result
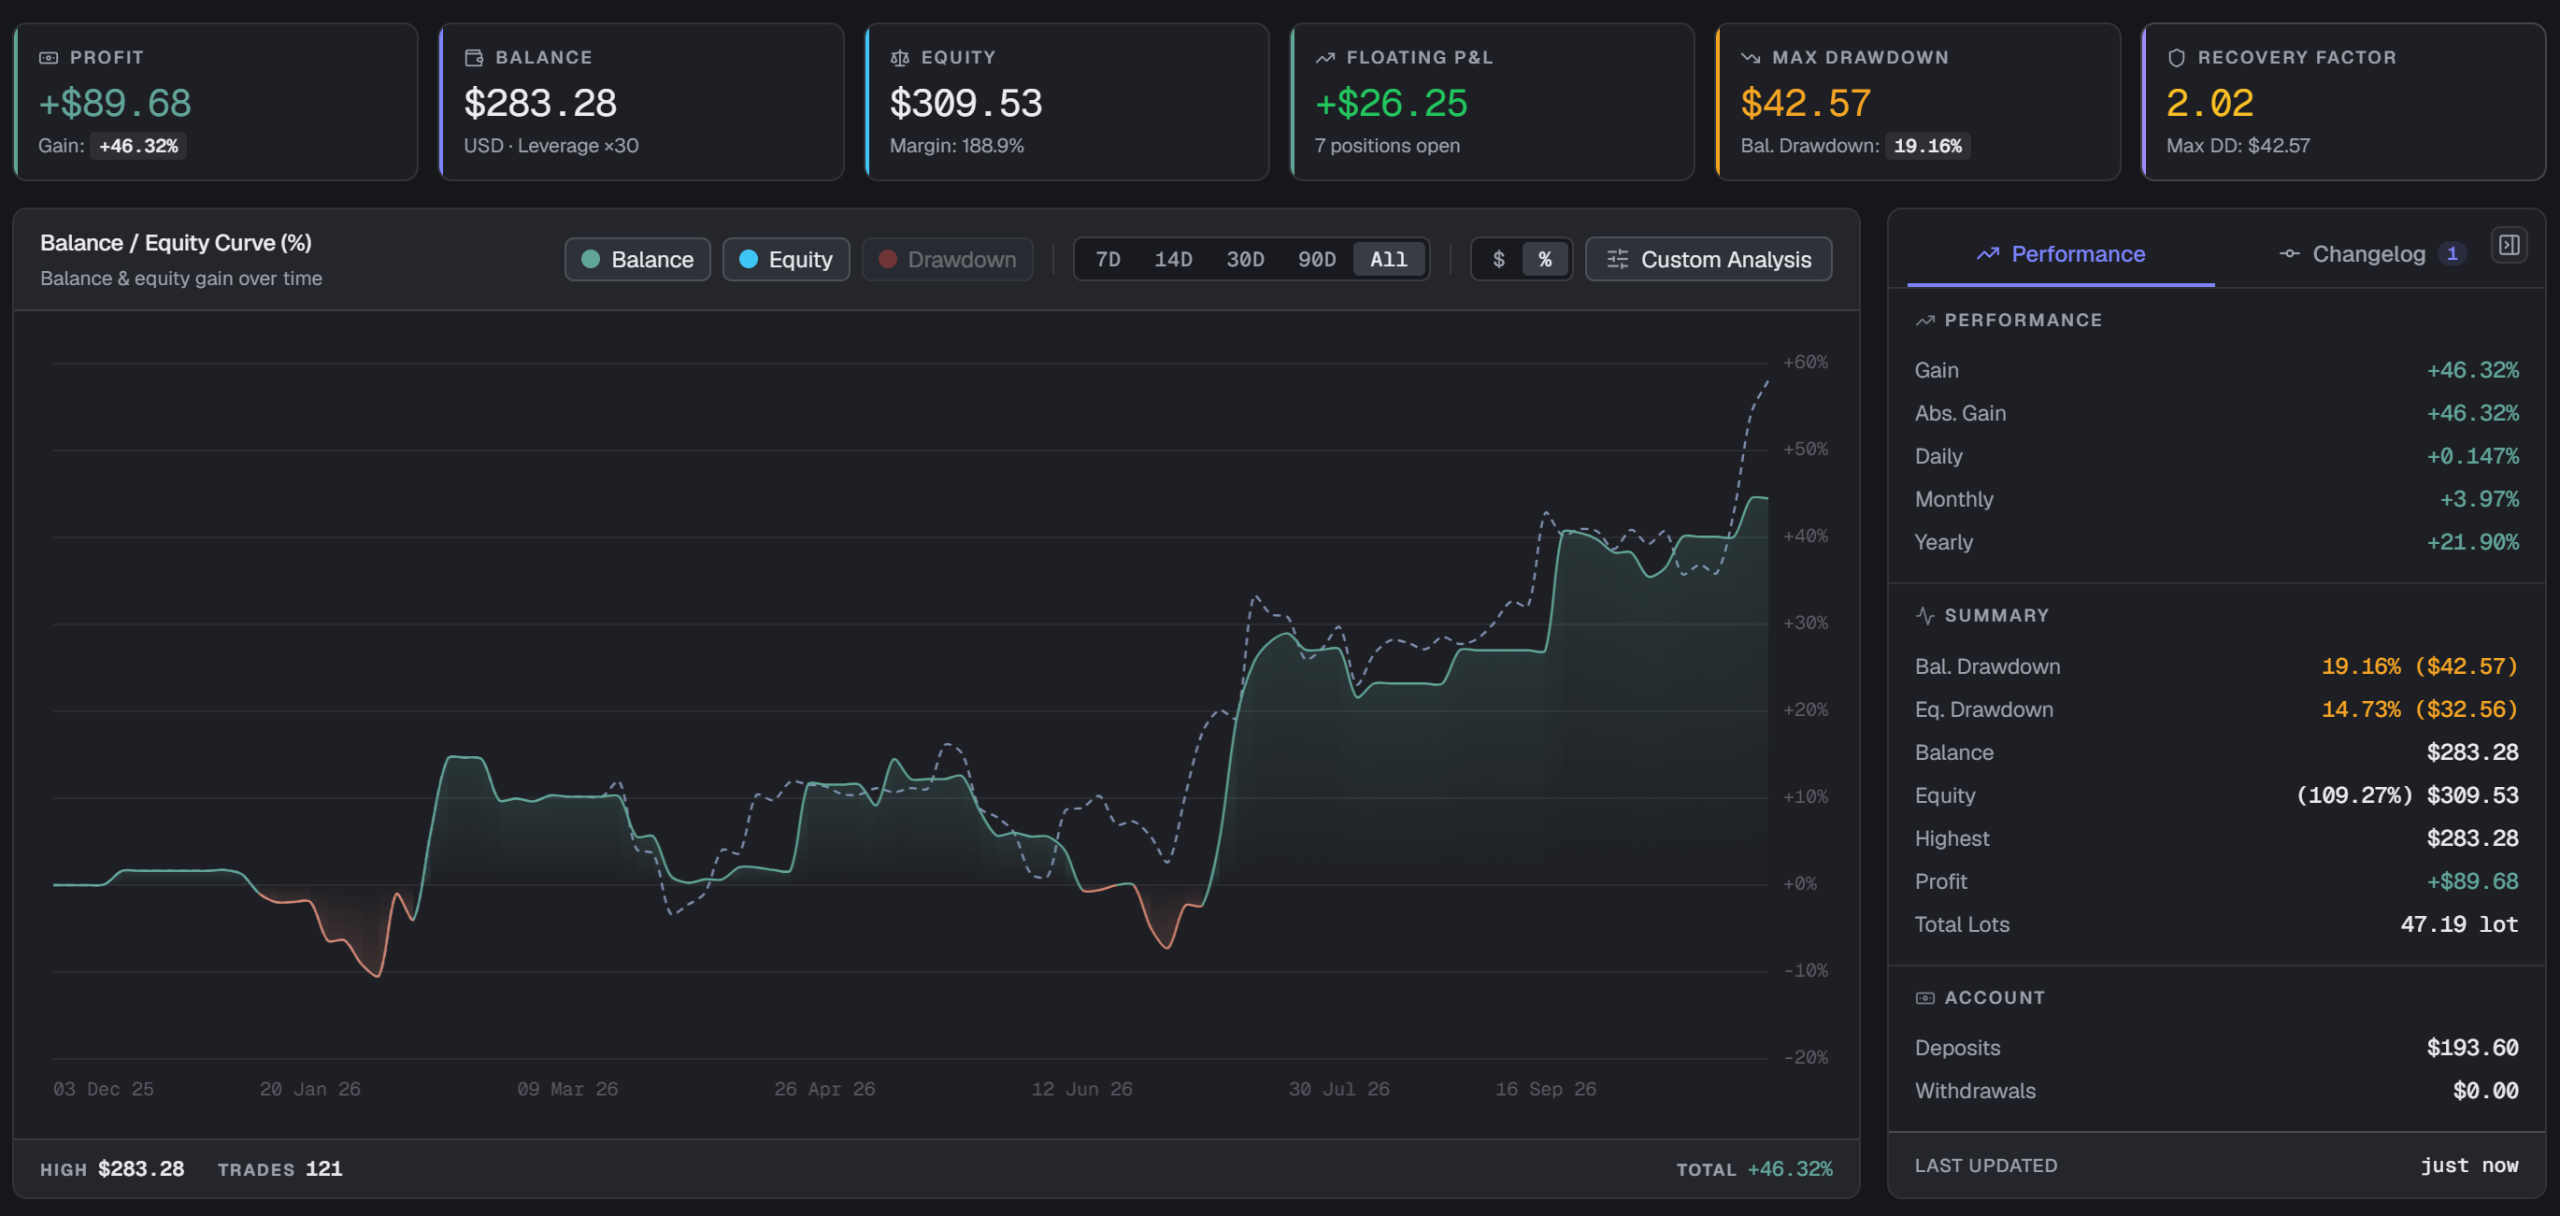
+41.52% in 2026, +43.85% since the signal started.
Is this an insane result? No 🤷♂️ For anyone used to hype instruments like gold and EAs that live for months rather than years, definitely not. But for the stock market it’s a very good figure. And this is still without the AI module, which I’ll get to below.
For context: the S&P 500 entered October at around 7,750, roughly +12.5% year to date. It set fresh records at the start of the month, approaching 7,810. So the index is at about +12–14% in total, and Stock Trader Pro is at roughly three times that. The honest caveat: the system’s volatility is higher than the index’s, and that’s the price of the higher return.
The key part of the chart: equity vs. balance
If you only look at the final number, you can miss the main thing. Look closer at the chart.
💚 The green equity line runs above the blue balance line for most of the year. That means that despite the geopolitical crises (the US–Iran war, tariffs, Greenland, fears of an AI bubble) and the drawdowns, the system’s floating profit mostly stayed positive.
The system doesn’t hold everything as dead weight. Part of the positions are cut, and the profitable ones are left to keep working. That’s portfolio management, not blind holding in the hope that something eventually recovers 🎯
You can also see stretches where equity drops below balance, in the spring. I’m not hiding them: that’s the system building positions in fear. More on that in the next section.
How it works: buy the dip
Stock Trader Pro’s logic is simple, and its signals are built on a combination of RSI + Stochastic.
- Fear. The market falls, stocks drop into the discount zone, and the system builds a position. The month closes red.
- Recovery. The market retraces the drop, and the system books profit. The month closes strongly green.
- Rotation. The stock market is great because assets often move in different directions at the same time. While the index falls, defensive names rise and balance the portfolio. That’s diversification not across different systems, but built right into one.
Here’s how it looks month by month in 2026:
*October is still in progress.
Four losing months out of ten, and that’s not a bug. Look at the pairs: January −11.83 → February +22.26 and June −5.54 → July +21.17. A red month here means a position is being built, and a strongly green one means it paid off. That’s why the curve is stepped rather than smooth.
Anyone promising you a straight line up on the stock market either doesn’t understand the market or isn’t telling you everything 🙂
How to read this signal
A few things I want to say plainly.
- The account is small. The signal runs on an account of roughly $200–300, so look at percentages, not dollars. Most of my clients run the system standalone on their own accounts, many of them 100k+ accounts dedicated to it.
- Volatility is higher than the index’s. That’s the price of the higher return, and it needs to be factored into your deposit size upfront.
- One year isn’t enough. That’s why I look at the distance: according to client accounts, there has been no losing year since 2020, including the bearish 2022. Back then the system didn’t bleed, it stagnated.
- There was a pause. For a little over a year, starting in 2023, I had to keep the EA switched off because of the situation in Ukraine and personal matters. I turned it off right before the rally. That’s just life, not part of the strategy, but I’m not going to hide it.
What’s next: the AI layer
Everything above is what the system shows without the AI module. Until now I handled macro and fundamentals crudely, with an “SP500 + EMA trend” filter. It worked, but I considered it too blunt. So I’ve finished a layer that replaces those filters: for each symbol, the AI delivers a verdict (enter or block) based on news flow, the global macro picture and the company’s own fundamentals. Technical analysis stays with the strategy, and the verdict belongs to the AI.
This layer ships in version 4.0. Details will come in a separate post.
Who it’s for
Stock Trader Pro is built for professional investors who understand what genuine long-term investing means and are ready to sit through a red month while a position is being built. It’s for those who care less about a pretty curve and more about a system that keeps working year after year.
It’s not for anyone expecting a green month every 30 days 📅
Author website / source: https://www.mql5.com/en/market/product/36161